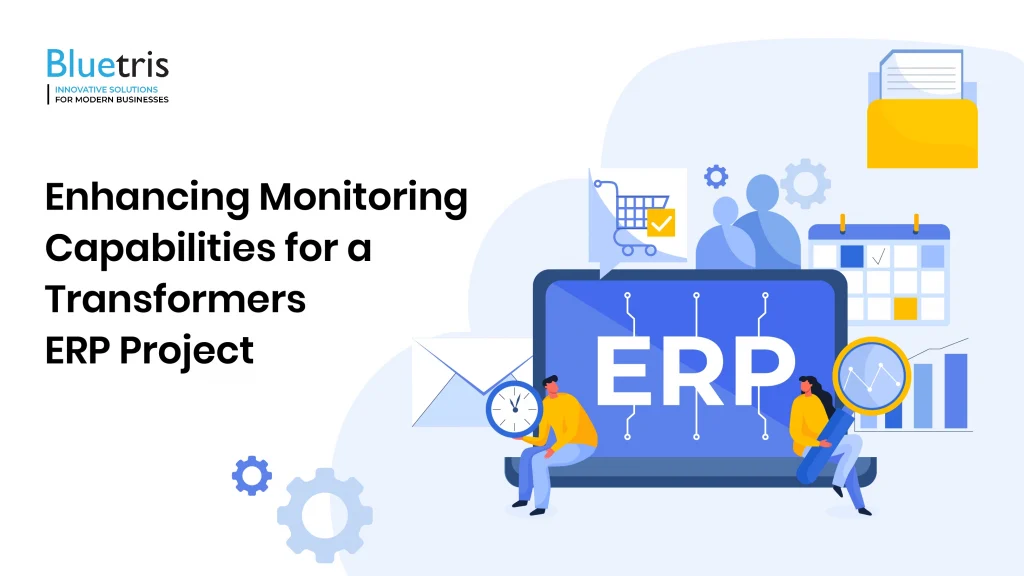
Bluetris

Introduction

The management and operation of an Enterprise Resource Planning (ERP) system for a specialized industry like Transformers manufacturing requires robust monitoring infrastructure to ensure optimal performance, reliability, and efficiency. This case study outlines the implementation of an advanced monitoring solution for an ERP project tailored to the unique needs of a Transformers manufacturing company.

Client Overview

Our client, a leading Transformers manufacturer, approached us to enhance their ERP system’s monitoring capabilities. The company’s ERP system played a critical role in managing production processes, inventory, supply chain, and customer relations. With increasing complexity in their operations, they sought a comprehensive monitoring solution to identify and resolve issues proactively, minimize downtime, and optimize performance.

Challenges

  • Lack of comprehensive monitoring: The existing monitoring setup was inadequate, lacking real-time visibility into key metrics such as resource utilization, system health, and application performance.
  • Scale and complexity: The ERP system encompassed multiple modules and processes, spanning production, inventory management, sales, and finance, making it challenging to monitor and manage effectively.
  • Industry-specific requirements: Transformers manufacturing involves specialized processes and machinery, necessitating monitoring of equipment performance, energy consumption, and production efficiency.
  • Proactive issue detection: The client needed a solution capable of detecting anomalies and performance degradation before they impact operations.

Solution: To address these challenges, we proposed a monitoring solution leveraging the ELK (Elasticsearch, Logstash, Kibana) stack, Fluent Bit, Prometheus, Grafana, and other complementary tools.


Implementation Steps

Infrastructure Setup:

  • Deployed Elasticsearch cluster to store and index log and metric data.
  • Installed and configured Logstash for log parsing and enrichment.
  • Implemented Fluent Bit agents on servers and containers for log collection and forwarding.
  • Set up Prometheus for scraping and storing time-series metrics data.

Data Ingestion and Processing:

  • Developed custom log parsing configurations in Logstash to extract relevant information from application and system logs.
  • Configured Fluent Bit to collect logs from various sources, including application containers, servers, and networking devices.
  • Integrated Prometheus exporters with critical components of the ERP system to collect metrics data.

Dashboard Creation:

  • Designed comprehensive dashboards in Kibana and Grafana to visualize log and metric data.
  • Created custom visualizations and alerts to monitor key performance indicators (KPIs), such as transaction throughput, database latency, and server health.

Alerting and Notification:

  • Configured alerting rules in Prometheus and Grafana to trigger notifications for abnormal conditions or threshold breaches.
  • Integrated with external communication channels like Slack and email for alert dissemination.

Performance Tuning and Optimization:

  • Fine-tuned data retention policies and indexing settings in Elasticsearch to balance storage efficiency and query performance.
  • Optimized Prometheus scraping intervals and resource utilization to minimize overhead.

Documentation and Training:

  • Documented the monitoring architecture, configurations, and procedures for future reference.
  • Conducted training sessions for the client’s IT and operations teams to ensure proficient use of the monitoring tools.

Results

  • Enhanced Visibility: The client gained real-time visibility into their ERP system’s performance, with centralized dashboards providing insights into log events, metrics, and trends across modules and processes.
  • Proactive Issue Detection: The monitoring solution enabled early detection of anomalies and performance degradation, allowing the client to address issues before they escalated and impacted operations.
  • Improved Efficiency: By identifying and resolving bottlenecks and inefficiencies, the client improved resource utilization, reduced downtime, and optimized overall system performance.
  • Streamlined Operations: Automated alerting and notification mechanisms streamlined incident response and resolution processes, enhancing operational efficiency and minimizing manual intervention.
  • Scalability and Flexibility: The modular and scalable nature of the monitoring infrastructure allowed the client to adapt to evolving business requirements and scale their monitoring capabilities as needed.

Conclusion

The successful implementation of the monitoring solution empowered our client to effectively manage and optimize their ERP system for Transformers manufacturing. By leveraging industry-leading tools and best practices, we provided a robust monitoring framework that ensures reliability, performance, and resilience in their operations. This project underscores our commitment to delivering tailored solutions that meet the unique needs of our clients and drive business success.

Leave a Reply

Your email address will not be published. Required fields are marked *

Get started today

Mobile App Development Consultation
1. Contact us

Fill the contact form protected by NDA, book a calendar and schedule a Zoom Meeting with our experts.

Mobile App Development Consultation
2. Get Consultation

Get on a call with our team to know the feasibility of your project idea.

Mobile App Development Consultation
3. Get estimate

Based on the project requirements, we share a project proposal with budget and timeline estimates.

Mobile App Development Consultation
4. Project kickoff

Once the project is signed, we bring together a team from a range of disciplines to kick start your project.

Our Engagement Models